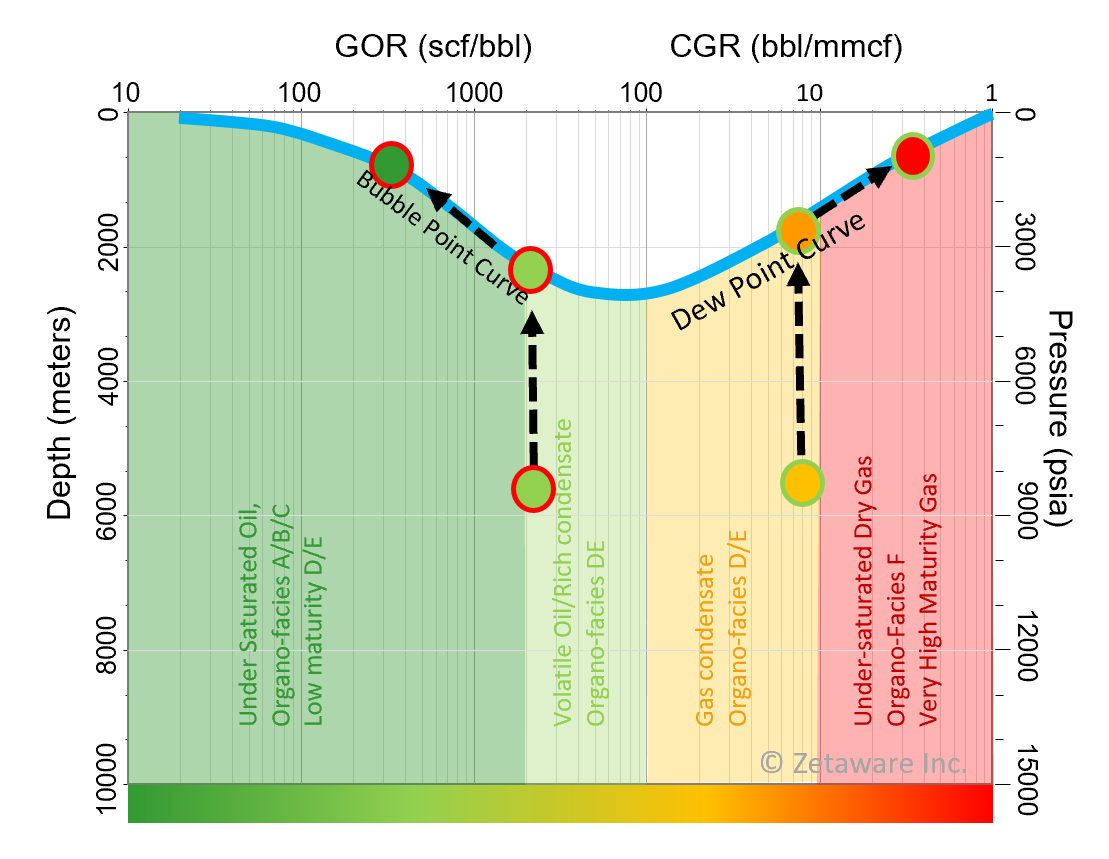
I came across this phase diagram recently and like to explain what I see. What is this fluid, what are the likely properties, and what geological processes may have created it? I posted on LinkedIn as a question and had many good suggestions that I have incorporated in the explanation below.
Sunday, June 18, 2023
Phase Behavior of Mixed Petroleum Fluids
Thursday, June 15, 2023
Petroleum Reservoir Fluid Types
The five main type of reservoir fluids, black oil, volatile oil, retrograde gas, wet gas and dry gas, are used mainly by engineers for designing production facilities based on what is expected to happen to the fluid during production. It is often confusing to geologists as we tend to focus on the range of properties of each fluid type, such as API gravity, GOR and color etc. offered in literature tables like this one:
However, the classification does not actually depend on these properties, instead it depends on the fluid's phase behavior and initial reservoir PT conditions. The same exact fluid can be a retrograde gas, or a volatile oil simply due to a few degrees difference in reservoir temperature. A fluid may be retrograde gas at a given reservoir temperature, but a wet gas if the reservoir temperature is higher. These typical ranges of properties are only a guide. In nature some gas fields have heavy condensates (<40 API gravity), whereas some black oils are colorless and very light (55 API). I hope this essay can help the PSA community in their petroleum system evaluation and communicate with engineers and managers better.
The standard fluid types are determined by the position of the initial reservoir PT condition relative to the fluid's critical point, cricondentherm and separator conditions (Fig. 1). If reservoir temperature is lower than the critical temperature of the fluid it is oil (liquid), and when pressure drops it will cross the bubble point and thus also called a bubble point fluid. If the reservoir temperature is higher than the critical temperature, it is a gas (vapor), and also called a dew point fluid. Black oil and volatile oils are separated by the shrinkage factor (FVF) ; Among the gas types, it is called retrograde gas if condensate can form in the reservoir (Tc < T < Tct). If condensate cannot form in the reservoir (T>Tcc), but can in the separator, it is called wet gas. It is dry gas if no liquid drops out at the separator or surface.
Exceptions and odd fluid properties
![]() |
| Fig. 2. Normal relationship between API gravity and GOR. Fluids outside of the normal trend are likely formed under certain geological conditions, that may not happen to most fluids. |
Other names
References:
Friday, April 22, 2022
Petroleum Migration Rates and Distances
In my training classes, I am often asked about the rate and distances of oil and gas migration. There seems to be much confusion in understanding how petroleum migrates, and the controlling factors.
Migration Distance
Long distance migration are observed in many basins. Here is a list of basins I am familiar with:
- Athabasca field, Alberta basin, Canada > 700 km from the kitchen
- Orinoco oil field, Venezuela, > 100 km
- East Texas field, Texas, USA, > 100 km
- Wolfcamp accumulations near outcrop in central Texas, Permian basin, > 200 km.
- Rubiales field, Llanos basin, Colombia > 100 km
- Mississippi oil trend in Kansas, Anadarko basin, > 500 km
- Ghawar field, Saudi Arabia, > 200 km.
- Oil fields in Saskatchewan ( Viewfield, Cactus Lake ...) and Manitoba (Sinclair), Canada migrated from the Williston basin, North Dakota, >100 km.
- Illinois basin, oil pools > 200 km away from the mature New Albany source rock.
- Hangjinqi gas field, Erdos basin, 130 km based on maturity analysis.
Migration Rate
![]() |
| Figure 2. Typical burial history from deep water of Gulf of Mexico basin. The main generation window occurs over about 10 million years. |
Flow Mechanism
Simple experiment/Analog for Migration
Saturday, November 20, 2021
Phase Separation & Implications in HC Migration
Here are two videos of CCE (constant composition expansion) PVT test videos kindly provided to us by Murray Macleod at Core Labs Perth. These tests are used by engineers to determine bubble or dew point pressure (pressure at which the single reservoir fluid becomes two phase). In this blog I would like to talk about the implication of this in HC migration process. I hope this helps those geoscientists not so familiar with PVT/phase behavior. I wish I had learnt this earlier in my career as a petroleum geologist.
In the CCE tool, the rotating cylinder moves away to expand the volume of the chamber thus lowering the pressure. The first video shows what happens to a single phase volatile oil when pressure is decreased from 8000 to about 1000 psi. At about 3300 psi (which in a basin would be at about 2200 meters depth), vapor (gas) bubble begins to form (hence the term bubble point pressure).
Saturday, November 6, 2021
Is Uplift/Erosion A Significant Risk for Petroleum Systems?
When the basin experiences uplift and erosion, the source rock may cease to generate hydrocarbons, and structures formed afterwards may not receive charge; existing oil accumulations may form gas caps, and gas caps may expand and cause oil to spill; reservoirs may get too shallow and oil may get biodegraded; seals may become ineffective and the accumulation may be completely destroyed. Given these reasons, you would think it would be hard to find oil and gas in such basins?
Lets first look at it not from the tradition process driven perspective but from a statistical one. More than 80% of the world's petroleum reserves are found in basins with uplift and erosion (well, I did not calculate the precise percentage, but just thinking of North America, Venezuela, Russia, the middle East, North Africa, etc.). So if had all the knowledge we have before any petroleum had been found yet, we would have had a much higher chance to find oil and gas fields in an uplifted basin, than one that is not.
The petroleum industry began in the 19th century in Pennsylvania/Ohio, in the Appalachian basin, and the first well found oil at just 20 meters below surface. The basin has been uplifted since 200 my and between 3 to 5 km of sediments have been removed, which is why the oil was found at such shallow depths in the first place. The petroliferous basins in North Africa have experienced two significant erosion events, on in Hercynian, and then more recently during the Alpine orogeny (figure 1). Yet some of the biggest fields are found here, such as the Hassi Messaoud and El Borma. In the US, the giant East Texas oil field (10 billion OOIP), and giant Hugoton gas field (80 TCF) are both very shallow due to uplifting since Cretaceous time; and the list can go on and on. It seems to be a rule, rather than exception with so many cases. It leads me to conclude that perceived risks of seal and timing in uplifted basins are probably unfounded.
![]() |
| Fig. 1. Burial history in the Ghadames basin, where giant fields like the El Borma, and the famous Hassi Messaoud field are located. |
Sunday, October 10, 2021
Downward Migration: Observation and Mechanisms
by Zhiyong He, ZetaWare, Inc.
Observation:
I have been asked often in my training classes about downward migration. Is downward migration limited, or does it present a higher risk? What is the mechanism for large scale downward migration/charge? Is there a way to estimate the volumes for upward vs downward migration?
I want to start with observations. Many large accumulations have been discovered in reservoirs stratigraphically older than the source rock in many basins. Here are some examples that I am familiar with:
- North Sea, Middle Jurassic and older reservoirs below the KCF
- North Africa, the Cambrian, Ordovician sandstone reservoirs in Ghadames, Illizi and Murzuq basins, below the Silurian hot shale source cock. The giant Hassi Messaoud field produces from Cambrian, some distance below the source rock.
- Bohai, Oil fields in Paleozoic basement, “Buried Hills”, karst tomography, between and under the Tertiary grabens that contain the Oligocene source rock.
- Similarly, the Bach Ho (White Tiger) oilfield in fractured granite basement underlying Oligocene source rocks in Vietnam.
- The biggest oil fiend in the United States lower 48 is the East Texas Field (> 10 billion barrels) that produces from the Woodbine sandstone directly below the Eagle Ford source rock.
- The biggest oil field in Anadarko basin is the Oklahoma City Field which produces from the Ordovician Wilcox formation, charged from the Devonian Woodford source rock above.
- In California, the giant Midway-Sunset oil field also produces from the Temblor formation below the Monterey source rock.
- Muddy/Dakota reservoirs underlying the Mowry shale in Powder River basin.
- Cambrian and Ordovician oil and gas fields charged from the Utica source rock above in Ohio and Indiana, of the Appalachian basin.
- Three forks reservoirs and the Bakken source rock above in Williston basin.
- The Norphlet plays in onshore Mississippi, Alabama and more recently the Eastern GoM deep water where the Smackover is the source and the seal.
- The Tuscaloosa sands below the Tuscaloosa Marine Shale (TMS)
- La Paz field, Maracaibo basin, Venezuela. Reservoirs are Cretaceous limestone and fractured granite basement, below the La Luna source rock.
- The Augila-Naafora field, Sirte basin, Libya. Cretaceous source rock above and onlapping onto basement reservoir and provides the seal.
- Suban gas field, South Sumatra, Indonesia and Adang Utara oil field in Malay basin, producing from basement.
- The Paleozoic reservoirs (Sarah, Qasim, Saq) below the Silurian Qusaiba source rock (Hot Shale) in Saudi Arabia. These reservoirs produce super light oils in the western part, that may have been water washed, and gas condensates in the deeper eastern region.
- The source rock is often also the seal
- Reservoirs can be separated by one ore more shales/sands from the overlying source (eg. North Sea and Williston basin).
- In some cases, lateral juxtaposition across faults may help explain accumulations, and some are harder to explain.
- Check out this paper on basement fields around the world.
Downward Migration Mechanism
![]() |
| Fig. 1, Capillary drive mechanism for primary migration. Pressure in the non-wetting phase HC is higher due to saturation increase cased by HC generation. |
- Oil saturation and therefore capillary pressure in the center of the shale is higher as it is further away from the sand. Pc can be several hundred psi even at 20% oil saturation.
- Saturation at the boundary stays low as it is easier to expel due to the sharp gradient in Pc.
- Buoyancy gradient for oil (~0.1 psi/ft) or gas (~0.3 psi/ft) is much smaller compared to capillary gradients ( which can easily reach several hundred psi over the half thickness of the source rock)
- Capillary pressure is in addition to any pressure increase due to hydrocarbon generation, or compaction. And it is a higher in magnitude force than both over the source rock thickness.
Additional Controls
Discussions:
- Some have observed that Norphlet play seems to have limited column heights compared to structure closure, and have suspected that it could be due to the limited efficiency perceived of downward migration. Steve Walkinshaw observed that the Norphlet sand only has a oil column if the overlying Smackover porosity is filled, or where the Smackover is tight (http://www.visionexploration.com/norphlet.htm), implying that it may be volume limited.
- My own interpretation, based on concepts given this presentation and my other presentations on seals/column height and charge limitation, is that these could be seal capacity limited. Where the Smackover is tight, it is simply a better seal. In my observations and estimates, where column height is less than the trap closure, it is often are often limited by the seal capacity, rather that charge volumes. We may find stacked pays with similar columns. In some cases, we may find an empirical correlation between column heights and effective stress.
- In general, volume can be limited if the fetch areas are small or the source rock is very weak. However, in majority of cases, trap sizes are typically much smaller than the estimated change volumes.
- We may never know the reason for sure in a particular case. So we should use any empirical rule of thumb we can find if it helps to reduce risk. Meanwhile, we should continue to look for evidence, correlations and new explanations.
Conclusions:
- Downward migration should be very effective as large scale forces exist to drive downward migration.
- If the reservoir/carrier is directly below source rock, chance of charge should be high as evidenced by the examples of several prolific basins.
- Lateral juxtaposition across faults may be helpful, especially for migration into reservoirs further down stratigraphy, but it is not required for sands directly below the source rock.
Saturday, February 13, 2021
Where Did All The Gas Go?
This is my summary of the same titled LinkedIn post, where I asked for analogs of known gas fields that are interpreted as sourced from an oil prone source rock due to high maturity. We have received more than 130 comments, and 13,000 views at the time of this post. I want to thank all who participated in this crowd wisdom experiment.
The background is that we have all come to use to burial histories and maturity maps from basin models showing oil and gas windows. Particularly, gas windows colored in red are giving exploration managers a heartburn. In recent years as we started to look at petroleum systems from the top down, the large dataset of basins and fields globally show that the organo-facies dominantly control what fluid type we find in the basin. The second most significant factor we find is the reservoir pressure (pvt control), in conjunction with seals that determine oil vs gas in traps in a mixed source environment. The effect of thermal maturity, which the original schematic diagram from Tissot et all were meant to show, plays only a minor role.
1) Some of the examples are from basins with mixed source rocks, such as the North Sea, which has the well-known oil prone KCF, but also the gas prone Heather, and potentially Paleozoic coals. The Western Desert of Egypt falls into this category (left side of figure 2). These are basins with mixed oil and gas fields, and as I will discuss below, PVT conditions may be an important control.
2) Some very large gas fields at shallow depth may be formed by phase separation. The Hassi R'Mel in Algeria may be explained as a Sales 1997 class I trap where significant solution gas in oil was released as oil migrated to shallow depth and displaced the oil. Similar large gas fields include the Hugoton field (largest gas field in North America), and the Troll field in the North Sea. These fields are less than 1500 m deep, and all have an oil rim. Based on standard PVT diagrams, at about 2000 psi in reservoir, any charge between 400 scf/bbl and 60,000 scf/bbl will result in a dual phase reservoir. Although in these examples, a partial contribution from a more gas prone facies may not be ruled out, the shallow depth (low pressure) have made fluid phase almost independent of the charge from source. Some of the shallow Eastern Siberia oil and gas fields, many of which are dual phase, may fall in to this category.
3) Some of the gas fields, such as the North field in Qatar (largest in the world) and the Astrakhan in Russia, the Rimbey gas field at the deep end of the Leduc reef trend in Alberta, the Norphlet trend in Alabama and the Sichuan gas fields. The commonality of these are they are associated with carbonates, in which thermal cracking of oil can be greatly accelerated by TSR. These fields are all sour (high H2S and CO2). Cracking to gas at oil window temperatures make it likely to happen during migration. In the case of the North field and the Permo-Triassic gas fields in southern Iran and the UAE, there is also evidence that they may have been generated by a low quality Qusaiba facies.
![]() |
| Figure 4. Effect of TSR on thermal cracking of oil to gas. Gas condensate can be formed at much lower temperatures compared to normal cracking kinetic models. Data from Zhibin Wei et al. 2011. |
4) As usual, these are not the only possible explanations, and often several factors contribute. The main point of this post is that it is relatively rare to find conventional gas accumulations due to a very good oil prone source rock being over mature. The exception being when we started drilling very close to the source kitchen, maturity does come into play. The deeper sub salt fields in the Campos basin offshore Brazil, such as the Pão de Açucar, the Austin Chalk play near the Eagle Ford gas window, and the Elgin-Franklin fields in the North Sea, are examples. These tend to be condensate rich (100-200 bbl/mmscf) as supposed to dry gas. Of course if our target is the source rock itself, we would expect to find gas in the gas window.
The WoS Application
Here I would like to use the example of the West of Shetland basin to demonstrate how to analyze a petroleum system from the top down when traditional PBSM modeling does not provide the answers. The WoS is a Jurassic rift basin in the north Atlantic, and the Kimmeridge Clay formation is an excellent marine source rock. Much modeling work has been focused on the complex thermal history, with rifting, and Eocene volcanism, the source kinetics, the suppressed vitrinite reflectance ..., but have not explained the fluids in the basin.
The top down method as applied here is this. Since the source rock is a very oil prone one, with hydrogen index up to 1000 mg/gTOC. The bulk of the accumulations should be oil, regardless of maturity or timing. The GOR and API gravity of the oils should increase with depth due to various reasons, such as migration lag effects, gravity fractionation, and bubble point controls, as shown in figure 6, on the right. The small gas fields are likely result of phase separation, rather than maturity, and the GOR for those are higher at shallow depth due to dew point control. J. Sales 1997 concept may be at work here, that small traps on spill path will have phase separated gas, whereas large relief structures should contain oil. That is what has been observed here.
Zhiyong He,
ZetaWare, Inc.
References:
He Z. and Murray A. (2019) Top Down Petroleum System Analysis: Exploiting Geospatial Patterns of Petroleum Phase and Properties. AAPG Search and Discovery, #42421
Pepper A. and P. Corvi, 1995, Simple kinetic models of petroleum formation. Part III: Modelling an open system. December 1995 Marine and Petroleum Geology 12(4):417-452
Sales, J.K., 1997, Seal strength vs. trap closure—a fundamental control on the distribution of oil and gas, in R.C. Surdam, ed., Seals, traps, and the petroleum system: AAPG Memoir 67, p. 57–83.
Oistein Glaso, 1980 "Generalized Pressure-Volume-Temperature Correlations," Journal of Petroleum Technology.
England, W.A., 2002, Empirical correlations to predict gas/gas condensate phase behavior in sedimentary basins, Org Chem 2002, 33(6):665-73
Wei, Z. et al., 2012 Thiadiamondoids as proxies for the extent of thermochemical sulfate reduction, Organic Geochemistry, 44 (2012) 53-70
Tuesday, December 22, 2020
Does complex geochemistry of an oil mean a multi-stage filling history?
In the last few years Zhiyong and I have talked a lot about “top down” petroleum systems, analysis (e.g. He and Murray, 2019), one aspect of which is “geochemical inversion”. Petroleum is a natural material containing 100’s of thousands of individual compounds, mostly hydrocarbons. Although the composition is complex it is not random: it encodes signals inherited from the original organic matter as well some related to thermal or biological processes during or after formation. Geochemists interpret this to provide information on the origin and history of a reservoir fluid.
However, I get
nervous when the results of geochemical inversion suggest complicated charge
histories which are not matched by an equally complicated geological/tectonic
history. Recently I reviewed a paper which suggested eight discrete charge
events had contributed to the fill for a cluster of fields. The corresponding
burial history looked fairly simple so it was hard to imagine how charge could
be anything but smooth and continuous in the area. I have a feeling that
interpretations like this arise from a lack of recognition of how heterogeneous
fluid compositions can be, even in well-connected reservoirs, charged slowly
and continuously by a single source rock.
In an AAPG talk last
year (Murray and He, 2020) we noted that it is quite common for the oil
underlying a gas cap to be undersaturated with gas. This shouldn’t be
surprising, given that the rate of filling – which is limited by the rate of
kerogen maturation during burial - is of the same order of magnitude as the rate
of diffusion driven mixing. If the
kerogen organofacies is not uniform (normal for fluvio-deltaic and
fluvio-lacustrine source rocks in particular), and fluids are not fully mixed,
we would not expect the fluids in the reservoir to be uniform either.
Furthermore, since fluids are expelled over a source rock maturity range from ~
0.7 to 1.3% Ro (vitrinite reflectance), we would not expect to find a uniform “maturity”
signal in most oils either, whether it is based on methylphenanthrene isomer
ratios or gasoline range ratios or whatever.
My experience of
reservoir geochemistry studies, where samples from multiple depths, units and
wells within a single field are examined, mostly confirms these expectations: A
lot of fields I have looked at do not contain well-mixed fluids, independently
of any physical compartmentalisation that may exist. This is hardly a new observation:
England (1990) commented on it in relation to the Forties field for example.
Indeed, it is more surprising when reservoir fluids are found to be well
mixed. I have seen examples of this too
though and it seems to be when (a) geometric factors in migration homogenise
fluids before or during their arrival at the trap or (b) thermal disequilibrium
accelerates density overturn via convection and therefore mixing. My colleagues
and I described the latter process in respect of the remarkably well mixed
fluids in the Sunrise gas-condensate field (James et al., 2010). Well-mixed
fluids are also quite common in fractured carbonate reservoirs where mixing
pathways are short due to polygonal fracturing.
My point in mentioning the unmixed fluids is that geochemical inversion
studies frequently base their conclusions only one sample from each particular
field or reservoir, without taking this into account.
A specific example of geochemical inversion is the interpretation of patterns of biodegradation in terms of reservoir temperature vs. charge history. Biodegradation, which occurs at temperatures lower than about 80 °C, has easily recognisable effects on oil. The most characteristic feature is the complete or partial loss of the n-alkanes (also called n-paraffins). These straight-chain compounds are easily assimilated by bacteria and gas-chromatograms of biodegraded oils show their depletion relative to the “unresolved complex mixture (UCM)” hump. Note that no new material is formed here – bacteria do not convert straight chain hydrocarbons into the branched and cyclic hydrocarbons comprising the UCM – the latter are just more resistant to attack. A chromatogram of a crude oil with complete loss of n-alkanes is shown in figure 1.
![]() |
| Fig. 1 Gas chromatogram of a severely biodegraded oil from the Vincent Field, Australia (Murray et al., 2013) |
A so-called “polyphase”
or “hybrid” oil is one in which it is suggested that more than one discrete
charge/biodegradation event occurred. This is usually based on the simultaneous
presence of very easily degraded and very resistant compound. An example is the
co-occurrence in an oil of n-alkanes and the 25-norhopanes, a group of
pentacyclic terpane biomarkers associated with a severe level of biodegradation
(Peters et al. 2005 and references cited therein). The n-alkanes are attributed
to a component of the charge arriving after the reservoir temperature exceeded
80 °C when biodegradation stopped. A similar conclusion is sometimes drawn when
the gas chromatogram shows prominent n-alkanes on top of a large UCM, as shown
here in figure 2.
![]() |
| Fig. 2 Gas chromatogram of a “polyphase” biodegraded oil from the Lady Nora Field, Australia. MCH is methyl cyclohexane, a cyclic alkane which is relatively resistant to degradation |
Back in 2005 I worked
on a heavily biodegraded oil field in the Middle East. Being onshore and shallow it had been pattern
drilled and there were a lot of samples to play with. Gas chromatograms showed
the usual UCM with n-alkanes and resolved peaks from other simple compounds
present to variable degree. There was a good correlation between API gravity
and the area of GC-resolved peaks relative to the UCM, as shown in figure 3.
![]() |
| Fig. 3 Correlation between the total area of resolved peaks (relative to the UCM) and API gravity of oils from a large oil field in the Middle East region |
This correlation was
useful in estimating the API and the viscosity (by another correlation) of
fluids for which there was insufficient sample for direct measurements. However, in order to predict bulk properties
away from well control, we needed to understand the factors controlling the extent
of degradation. Because there were
spatially coherent differences in the degree to which light vs. heavy “fresh”
charge overprinted the UCM, I concluded, at the time, that there were multiple
stages of charge and degradation. The problem was that the burial history was
simple and charge should have concluded more than 100 Ma before present. At the time, I thought there must have been
things in the charge history – perhaps to do with “motelling” or some other
migration-related process - that were
not captured in the charge model. However, I revisited the report recently and realised
there is another possibility. It goes like this…
Several studies have shown that heating of the asphaltene fraction of a heavily biodegraded oil can release fresh oil, complete with the original complement of n-alkanes (Snowdon et al. 2016 and references therein). Asphaltenes are macromolecules with a composition and molecular structure similar to that of the kerogen from which they were derived (Snowdon et al. , 2016). Laboratory pyrolysis of asphaltenes is thus akin to the artificial maturation of kerogens. Figure 4 shows gas chromatograms (and density, viscosity) of a heavily biodegraded oil from a field in the Middle East region, before and after heating at 300 °C for 12 days and at 350 °C for 10 days. The thermal stress from these two heating regimes is equivalent to a vitrinite reflectance of 0.8 and 1.3% respectively.
![]() |
| Fig. 4 Gas chromatograms for the original oil from a large oil field in the Middle East region and after heating as shown. I.S. is the “internal standard” added to assist quantitative analysis |
If we can do this in
the laboratory, why would it not also happen in nature as a reservoir
containing biodegraded oils is buried deeper?
Let’s consider such a reservoir which is continuously buried so that the
temperature increases from 80 °C to ~ 120 °C over a period of
about 20 Ma. Using the kinetics of asphaltene conversion from laboratory
studies, we can estimate that about half of the mass of asphaltenes would be
converted to “fresh” oil. The
chromatogram, perhaps like that in Fig. 4B, would show a “polyphase” character,
without the requirement of any new charge arriving from the source rock after
biodegradation ceased.
What if the reservoir
is not heated as high as 120 °C? Could we still get an apparently polyphase oil?
I believe so: Some studies (see Snowdon et al., 2016 and references cited
therein) have shown that the source of fresh oil in asphaltene heating studies
is not only pyrolysis (i.e. the breaking of high-energy covalent bonds).
Rather, the cage-like molecular structure of asphaltenes appears capable of
encapsulating some of the original oil and preventing it from being biodegraded
in the first place. This oil can be released by thermal disruption of the
asphaltene clusters at temperatures lower than those required for pyrolysis.
Figure 5 shows before and after heating chromatograms for a crude oil which had
been severely biodegraded at the surface (following an oil spill). The
conditions used, 320 °C for 2 days, create a level of thermal stress similar
to that applied to the oil in figure 4B. However, in this case the post-heating
oil has lots of n-alkanes and only a very small UCM. I wonder how much of the
fresh oil here has been released prior to pyrolysis temperatures being reached.
![]() | |
| Fig. 5 Gas chromatograms for the original, biodegraded oil collected after a spill at sea and after heating at 320 °C for two days (from Oudot and Chaillan, 2009) |
In almost all cases where complex charge histories are invoked to explain geochemical anomalies, I can (at least in principle) explain them by things that happen during, normal continuous burial and supply of hydrocarbons. This doesn’t mean that the simple explanation is necessarily true - just that, in the absence of evidence for a complex burial/thermal history, we need not be as puzzled as I was back in 2005.
As with all these blog posts, I invite and indeed welcome push
back/comments/clarification. They are not peer-reviewed papers, just some observations
and thoughts from one individual.
Cheers,
Andrew Murray,
References:
England W. (1990) The organic geochemistry of petroleum reservoirs. Org. Geochem., 16, 415-425
He Z. and Murray A. (2019) Top Down Petroleum System Analysis: Exploiting Geospatial Patterns of Petroleum Phase and Properties. AAPG Search and Discovery, #42421
James B., Bailey W, Murray A., Pelechaty S., Kaiko A. and J. Li (2010) Unusual reservoir connectivity revealed by data integration at the Sunrise Field. APPEA J. 50th Anniversary issue, 349-370, Australian petroleum production and exploration association (A PDF is available from the author on request)
Murray A. and He. Z. (2020) Oil vs. Gas: What are the Limits to Prospect-Level Hydrocarbon Phase Prediction? AAPG Search and Discovery, #42513
Murray A., Dawson D.A., Carruthers D. and Larter S. (2013) Reservoir Fluid Property Variation at the Metre-scale: Origin, Impact and Mapping in the Vincent Oil Field, Exmouth Sub-basin. Proceedings of the Western Australian Basins Symposium, Petroleum Exploration Society of Australia, Perth, August 2013 (A PDF is available from the author on request).
Oudot J. and Chaillan F. (2009) Pyrolysis of asphaltenes and biomarkers for the fingerprinting of the Amoco Cadiz oil spill after 23 years. Nature Precedings. 4. 10.1038/npre.2009.2975.1
Peters K. E., C. C. Walters and J. M. Moldowan, 2005, The Biomarker Guide: Cambridge University 479 Press, Cambridge, U.K., 1155 p.
Snowdon L., Volkman J.K., Zhang Z., Tao, G. and Liu, P. (2016). The organic geochemistry of asphaltenes and occluded biomarkers. Org Geochem., 91, 3-15.
Friday, October 16, 2020
Composition Fractionation During Petroleum Migration
By Zhiyong He, ZetaWare, Inc.
One of the goals of petroleum system modeling and analysis is to predict fluid composition and properties (GOR, API gravity etc.). However, most of the work in the past has been focused on the generation process, with compositional kinetics, etc. Below I will try to show that the petroleum under goes significant changes in composition and properties along the migration pathways due a number of secondary processes not well understood yet. Most people are familiar with the Gussow (1954) migration model in the figure below. The trap closest to the kitchen would receive the latest, and most mature and therefore lighter fluid, which displaces less mature fluid to traps up dip.
![]() |
| Fig. 1. Differential entrapment of petroleum along migration path (Gussow, 1954). Late forming gas displaces oil to up dip traps. |
Even without forming gas caps, the later fluid tends to reach the crest of the trap because it is lighter and more buoyant. This pattern is generally true in most basins. Oils with lower gas oil ratios, and lower API gravities are found further away from the generation kitchen. Closer to the kitchen, lighter fluids, sometimes gas condensates are found.
There are a couple of other factors not obvious from the Gussow model. When the migrating fluid reaches bubble point, a separate gas (vapor) phase starts to form, as shown in the trap in the middle. The gas in the gas cap selectively dissolves the lightest fraction of the liquid as condensate. The remaining oil in the leg retains the heavier part of the incoming fluid. The physical properties in a dual phase trap would over time equilibrate to profiles shown in the figure below.
![]() |
| Fig. 3. Fluid property (API gravity and GOR) profiles in single phase reservoirs, plotted against depth below crest of the trap. Both API gravity and GOR decreases toward the oil water contact. |
Sunday, October 4, 2020
Gas Oil Ratio Trends In Sedimentary Basins & PVT Behavior
By: Zhiyong He, ZetaWare, Inc.
Gas oil ratios of oil and gas fields plotted against depth show interesting trends as shown below. The figure on the left is from large global datasets, and the one on the right is from an area in the North Sea. What are the reasons we may ask?
We have recently talked about this in several presentations (see references below). We concluded that this is a result of PVT behavior during migration. At shallower depth, the pressure is lower, and oil cannot dissolve as much solution gas as it can at a deeper depth. Likewise, gas can not dissolve much liquid at shallow depth.
In this figure above, the blue shaded area are based on thousands of saturation pressure (bubble point on the left and dew point on the right) measurements. As HC generation windows are typically deeper than the blue band, migrating fluid toward shallow depth will reach saturation pressure at different depth depending on initial GOR of the fluid coming from the source rock. But once the Psat is reached, GOR will be limited by Psat, and follow the trend of the Psat-GOR relationship, resulting the distribution in figure 1.
The initial fluid is found in a deeper reservoir (1) close to the kitchen, it is undersaturated as reservoir pressure is higher than initial Psat. In shallow trap along the migration path, the fluid is separated as a gas cap and an oil leg (2) and (3), with very different GOR and liquid API gravity. The fluid can further fractionate depending on whether migration is vertical or lateral, (4) and (5). Please also note that the saturation pressure itself is also modified by the same process, and becomes lower at shallow depths.