Saturday, November 20, 2021

Phase Separation & Implications in HC Migration

Here are two videos of CCE (constant composition expansion) PVT test videos kindly provided to us by Murray Macleod at Core Labs Perth. These tests are used by engineers to determine bubble or dew point pressure (pressure at which the single reservoir fluid becomes two phase). In this blog I would like to talk about the implication of this in HC migration process. I hope this helps those geoscientists not so familiar with PVT/phase behavior. I wish I had learnt this earlier in my career as a petroleum geologist. 

In the CCE tool, the rotating cylinder moves away to expand the volume of the chamber thus lowering the pressure. The first video shows what happens to a single phase volatile oil when pressure is decreased from 8000 to about 1000 psi. At about 3300 psi (which in a basin would be at about 2200 meters depth), vapor (gas) bubble begins to form (hence the term bubble point pressure). 


As pressure is further reduced,  more and more gas comes out of the solution and takes up the upper part of the chamber and the volume of the liquid decreases significantly (by a factor of more than 2 in this case). What is not obvious (and important for exploration) is that along with that the gas oil ratio (GOR) in the liquid also decreases. 

The following figure shows the path of the process in a geological setting. Following the 3 green circles from deep to shallow, the starting volatile oil (deepest green circle) has a GOR of about 2300 scf/bbl. During upward migration, phase separation starts when it reaches about 2200 meters. As the oil continues to migrate to shallower depth, it loses more and more gas. At the shallow depth, the GOR becomes 300 scf/bbl (a black oil). 

The lost gas may get trapped in small traps along the way, so we end up with an low GOR oil accumulation. Or if enough of the gas makes to the final trap, we may have a gas cap. If the trap is not able to support the column of oil and gas to spill point, it may leak the gas and retain only the low GOR oil. Or if the seal is very good but the trap is small, all of the oil may spill, and we end up with a gas accumulation. 

Again, let me be clear, although the source rock may have supplied a high GOR oil, the final trap may be a low GOR oil accumulation, or a gas accumulation, or an oil accumulation with gas cap. It is determined by the seal and the reservoir pressure!

A similar process applies to gas condensate fluid. Below is a CCE video for gas condensate. As the pressure decreases to dew point, a liquid phase forms at the bottom. The liquid volume increases as pressure decreases and more liquid comes out solution from the vapor phase. The GOR of the vapor increases (CGR decreases). Like the oil case, you may deduct what can happen at the final trap following the red circles in the figure above. Depending on if it leaks or spills, the trap may end up with a higher GOR gas, or a low GOR oil, or both. Check out the AAPG paper by John Sales (1997).    


If the starting fluid has a GOR between 3000 and 4000 scf/bbl, whether it is called oil or gas depends on what engineers find in the CCE test. If bubbles form at the top, it is called an oil, and if liquid forms at the bottom, it is called a gas condensate. This is how engineers decide if a field is called oil field or a gas condensate field. Note that even at 4000 scf/bbl, there is still more what geochemists call oil (C6+) in the fluid than gas (C1-5) in weight.   

Please let me know what you think by commenting, thanks!

Zhiyong He,
ZetaWare, Inc. 

Saturday, November 6, 2021

Is Uplift/Erosion A Significant Risk for Petroleum Systems?

When the basin experiences uplift and erosion, the source rock may cease to generate hydrocarbons, and structures formed afterwards may not receive charge; existing oil accumulations may form gas caps, and gas caps may expand and cause oil to spill; reservoirs may get too shallow and oil may get biodegraded; seals may become ineffective and the accumulation may be completely destroyed. Given these reasons, you would think it would be hard to find oil and gas in such basins? 

Lets first look at it not from the tradition process driven perspective but from a statistical one. More than 80% of the world's petroleum reserves are found in basins with uplift and erosion (well, I did not calculate the precise percentage, but just thinking of North America, Venezuela, Russia, the middle East, North Africa, etc.). So if had all the knowledge we have before any petroleum had been found yet, we would have had a much higher chance to find oil and gas fields in an uplifted basin, than one that is not.  

The petroleum industry began in the 19th century in Pennsylvania/Ohio, in the Appalachian basin, and the first well found oil at just 20 meters below surface. The basin has been uplifted since 200 my and between 3 to 5 km of sediments have been removed, which is why the oil was found at such shallow depths in the first place. The petroliferous basins in North Africa have experienced two significant erosion events, on in Hercynian, and then more recently during the Alpine orogeny (figure 1). Yet some of the biggest fields are found here, such as the Hassi Messaoud and El Borma. In the US, the giant East Texas oil field (10 billion OOIP), and giant Hugoton gas field (80 TCF) are both very shallow due to uplifting since Cretaceous time; and the list can go on and on. It seems to be a rule, rather than exception with so many cases. It leads me to conclude that perceived risks of seal and timing in uplifted basins are probably unfounded. 

Fig. 1. Burial history in the Ghadames basin, where giant fields like the El Borma, and the famous Hassi Messaoud field are located. 

Perhaps the most extreme cases are found in the San Juaquin basin in California, where several billion barrel fields are found literally at surface, due to reservoirs outcropping at surface. The Midway-Sunset oil field shown in figure 2 below, and the Kern River oil field are just a couple of examples.  

Fig. 2. Midway-sunset oil field in the San Juaquin basin (John Borkovich, 2019 CA State Water Resources Control Board). More than 3 billion barrels of oil had been produced by 2006. Gusher image from Wikipedia.  

For my 35 years as a basin modeler and later a practical petroleum system analyst, what I have seen is that the experts who conduct research and write papers tend to study the problems from a scientific/process perspective, focusing on the details, but tend to not look from the perspective of analogs and statistics that may contradict their research. In the past 10 years or so, I have been paying more attention and finding contradicting evidence from analogs and large dataset against some of our common wisdoms or misconceptions, such as my earlier posts on gas risk due to high maturity, timing risk, biodegradation risk, etc. This post is just another example.     

Sunday, October 10, 2021

Downward Migration: Observation and Mechanisms

by Zhiyong He, ZetaWare, Inc.


Observation:

I have been asked often in my training classes about downward migration. Is downward migration limited, or does it present a higher risk? What is the mechanism for large scale downward migration/charge? Is there a way to estimate the volumes for upward vs downward migration?

I want to start with observations. Many large accumulations have been discovered in reservoirs stratigraphically older than the source rock in many basins. Here are some examples that I am familiar with:

  1. North Sea, Middle Jurassic and older reservoirs below the KCF 
  2. North Africa, the Cambrian, Ordovician sandstone reservoirs in Ghadames, Illizi and Murzuq basins, below the Silurian hot shale source cock. The giant Hassi Messaoud field produces from Cambrian, some distance below the source rock.
  3. Bohai, Oil fields in Paleozoic basement, “Buried Hills”, karst tomography, between and under the Tertiary grabens that contain the Oligocene source rock.
  4. Similarly, the Bach Ho (White Tiger) oilfield in fractured granite basement underlying Oligocene source rocks in Vietnam. 
  5. The biggest oil fiend in the United States lower 48 is the East Texas Field (> 10 billion barrels) that produces from the Woodbine sandstone directly below the Eagle Ford source rock. 
  6. The biggest oil field in Anadarko basin is the Oklahoma City Field which produces from the Ordovician Wilcox formation, charged from the Devonian Woodford source rock above.
  7. In California, the giant Midway-Sunset oil field also produces from the Temblor formation below the Monterey source rock.  
  8. Muddy/Dakota reservoirs underlying the Mowry shale in Powder River basin. 
  9. Cambrian and Ordovician oil and gas fields charged from the Utica source rock above in Ohio and Indiana, of the Appalachian basin. 
  10. Three forks reservoirs and the Bakken source rock above in Williston basin.
  11. The Norphlet plays in onshore Mississippi, Alabama and more recently the Eastern GoM deep water where the Smackover is the source and the seal.  
  12. The Tuscaloosa sands below the Tuscaloosa Marine Shale (TMS)
Some other observed characteristics are:

  • The source rock is often also the seal 
  • Reservoirs can be separated by one ore more shales/sands from the overlying source (eg. North Sea and Williston basin). 
  • In some cases, lateral juxtaposition across faults may help explain accumulations, and some are harder to explain. 

Downward Migration Mechanism


I would explain downward migration as driven by the natural capillary process. The figure on the left below shows the typical capillary curves of a reservoir and a shale (source rock). The shale has a very steep curve and pressure increases quickly with HC saturation. The center and right figures show the theoretical capillary pressure (difference between the HC phase pressure and water pressure,  Pc = Po-Pw), profiles before and during HC generation. 

Fig. 1, Capillary drive mechanism for primary migration. Pressure in the non-wetting phase HC is higher due to saturation increase cased by HC generation.

During generation, as oil saturation increases in the shale, so does capillary pressure and the oil near the sand is pushed into the sand due to capillary pressure difference: energy/potential for the non-wetting phase HC fluid is much lower in the sand than in the shale.
  1. Oil saturation and therefore capillary pressure in the center of the shale is higher as it is further away from the sand. Pc can be several hundred psi even at 20% oil saturation.
  2. Saturation at the boundary stays low as it is easier to expel due to the sharp gradient in Pc.
  3. Buoyancy gradient for oil (~0.1 psi/ft) or gas (~0.3 psi/ft) is much smaller compared to capillary gradients ( which can easily reach several hundred psi over the half thickness of the source rock)
  4. Capillary pressure is in addition to any pressure increase due to hydrocarbon generation, or compaction. And it is a higher in magnitude force than both over the source rock thickness. 

Additional Controls

The above assumes a homogeneous layer of source rock. In nature, the source rock may vary vertically in pore sizes. If the source formation is deposited as a fining upwards sequence, the capillary pressure is higher at the top with smaller pores. This will cause more volumes to migration downward. 

If the source rock is overlain by a tighter formation, and underlain by a good reservoir, nearly all the volume will migrate downward. This may be the case with the biggest oil field in the lower 48 of US, the East Texas field. The Woodbine sandstone reservoir sits directly below the Eagle Ford source. The tight Austin chalk is above the Eagle Ford. 

If the source interval has inter-bedded silty zones, hydrocarbon saturation in the more porous zones will be higher in order for the Pc to exceed the sealing capacity of the tighter zones. This essentially creates the favorable condition for a unconventional play.  Check out this post for more on this

Overpressure and the "centroid" effects of carrier beds may further enhance downward migration. The figure below is after the North Sea, and the Norphlet examples. The water pressure in the source rock is expected to follow the regional compaction driven over pressure. The sand below has limited vertical extent, which causes the classic centroid pressure effect. The pressure in the sand will follow the line parallel to the hydrostatic pressure, but higher. At the deeper end, usually the HC kitchen, the shale is more over pressured than the sand below, and the resulting hydrodynamic force will help downward migration.  
Fig. 2, Effects of over pressure on primary migration. Downdip area of the carrier beds are under pressured relative to the source rock. At the crest, the opposite is true, which may limit column heights of accumulations.

Accumulations usually occur at the shallow end, and some volumes migrated below the source rock may leak up to younger reservoirs. Note that Both capillary force and centroid pressure drive help upward expulsion as well, if the sand is above the source. 

Discussions:

Human intuition is that we want to quantify the volumes that migrate upwards vs downwards, especially as a basin modeler. The uncertainty is large. I would simply assume that roughly 50% of the volumes should migrate downwards if the reservoir is directly below the source rock, plus/minus the uncertainty, more if there is a tight formation above the source rock. If the reservoir is further down stratigraphy, the risk goes higher, as it may need to rely on juxtaposition, or coarsening downward stratigraphy, etc. No, the modeling software cannot tell you this (whatever the vendor may claim their software can do), you have to make such arguments, or assumptions, like most things with basin modeling. 

Limited columns in Northpet traps:

  • Some have observed that Norphlet play seems to have limited column heights compared to structure closure, and have suspected that it could be due to the limited efficiency perceived of downward migration.  Steve Walkinshaw observed that the Norphlet sand only has a oil column if the overlying Smackover porosity is filled, or where the Smackover is tight (http://www.visionexploration.com/norphlet.htm), implying that it may be volume limited.   
  • My own interpretation, based on concepts given this presentation and my other presentations on seals/column height and charge limitation, is that these could be seal capacity limited. Where the Smackover is tight, it is simply a better seal. In my observations and estimates, where column height is less than the trap closure, it is often are often limited by the seal capacity, rather that charge volumes. We may find stacked pays with similar columns.  In some cases, we may find an empirical correlation between column heights and effective stress.  
  • In general, volume can be limited if the fetch areas are small or the source rock is very weak. However, in majority of cases, trap sizes are typically much smaller than the estimated change volumes.
  • We may never know the reason for sure in a particular case. So we should use any empirical rule of thumb we can find if it helps to reduce risk. Meanwhile, we should continue to look for evidence, correlations and new explanations.  

Conclusions:

  • Downward migration should be very effective as large scale forces exist to drive downward migration.
  • If the reservoir/carrier is directly below source rock, chance of charge should be high as evidenced by the examples of several prolific basins. 
  • Lateral juxtaposition across faults may be helpful, especially for migration into reservoirs further down stratigraphy, but it is not required for sands directly below the source rock. 


Saturday, February 13, 2021

Where Did All The Gas Go?

This is my summary of the same titled LinkedIn post, where I asked for analogs of known gas fields that are interpreted as sourced from an oil prone source rock due to high maturity. We have received more than 130 comments, and 13,000 views at the time of this post. I want to thank all who participated in this crowd wisdom experiment.   

The background is that we have all come to use to burial histories and maturity maps from basin models showing oil and gas windows. Particularly, gas windows colored in red are giving exploration managers a heartburn. In recent years as we started to look at petroleum systems from the top down, the large dataset of basins and fields globally show that the organo-facies dominantly control what fluid type we find in the basin. The second most significant factor we find is the reservoir pressure (pvt control), in conjunction with seals that determine oil vs gas in traps in a mixed source environment. The effect of thermal maturity, which the original schematic diagram from Tissot et all were meant to show, plays only a minor role. 

Figure 1. Traditional concept of oil/gas windows may have led to over-emphasis on maturity in our industry. Cumulative expelled products from Pepper and Corvi 1995 organo-facies  give more appropriate basin wide GORs, that are strongly a function of organo-facies, rather than maturity.
 
As the figure above shows, cumulative fluids expelled from the different organo-facies (Pepper and Corvi, 1995) differ greatly, and the proportions of oil and gas are very consistent with observations of accumulated fluids in basins regardless of maturity of the source rock. In short, we find that basins with very oil prone source rocks, such as the Tithonian of the GoM deep water, KCF of the West of Shetland, SHJ of the Bohai basins, have little or no gas discoveries although the source rock were over mature before the reservoirs were even deposited. On the other hand, basins with only gas prone source rocks have essentially no oil discoveries such as the Southern North Sea, areas of South China Sea, Rovuma Basin of Mozambique, and the Nile delta of Egypt. In basins with mixed oil and gas accumulations, as in many South East Asia basins. we find that the type of fluids and their properties are more controlled by the pvt conditions of the reservoirs, rather than maturity.    

Figure 2. The contracts among three different petroleum systems. The Nile delta has almost no oil fields, and the Gulf of Suez has almost no gas fields. The Western Desert has mixed oil and gas fields. Of course all three basins have part of the source rock in "oil window" and part in "gas window". The fluid types seem independent of that. 

The commenters provided quite a few potential examples, that I have tried to further look into and continue to learn about. Here I will attempt to group them in my proposed explanation to limit the length of this post. They fall into the following categories:

1) Some of the examples are from basins with mixed source rocks, such as the North Sea, which has the well-known oil prone KCF, but also the gas prone Heather, and potentially Paleozoic coals. The Western Desert of Egypt falls into this category (left side of figure 2). These are basins with mixed oil and gas fields, and as I will discuss below, PVT conditions may be an important control. 

2) Some very large gas fields at shallow depth may be formed by phase separation. The Hassi R'Mel in Algeria may be explained as a Sales 1997 class I trap where significant solution gas in oil was released as oil migrated to shallow depth and displaced the oil. Similar large gas fields include the Hugoton field (largest gas field in North America), and the Troll field in the North Sea. These fields are less than 1500 m deep, and all have an oil rim. Based on standard PVT diagrams, at about 2000 psi in reservoir, any charge between 400 scf/bbl and 60,000 scf/bbl will result in a dual phase reservoir. Although in these examples, a partial contribution from a more gas prone facies may not be ruled out, the shallow depth (low pressure) have made fluid phase almost independent of the charge from source. Some of the shallow Eastern Siberia oil and gas fields, many of which are dual phase, may fall in to this category.  


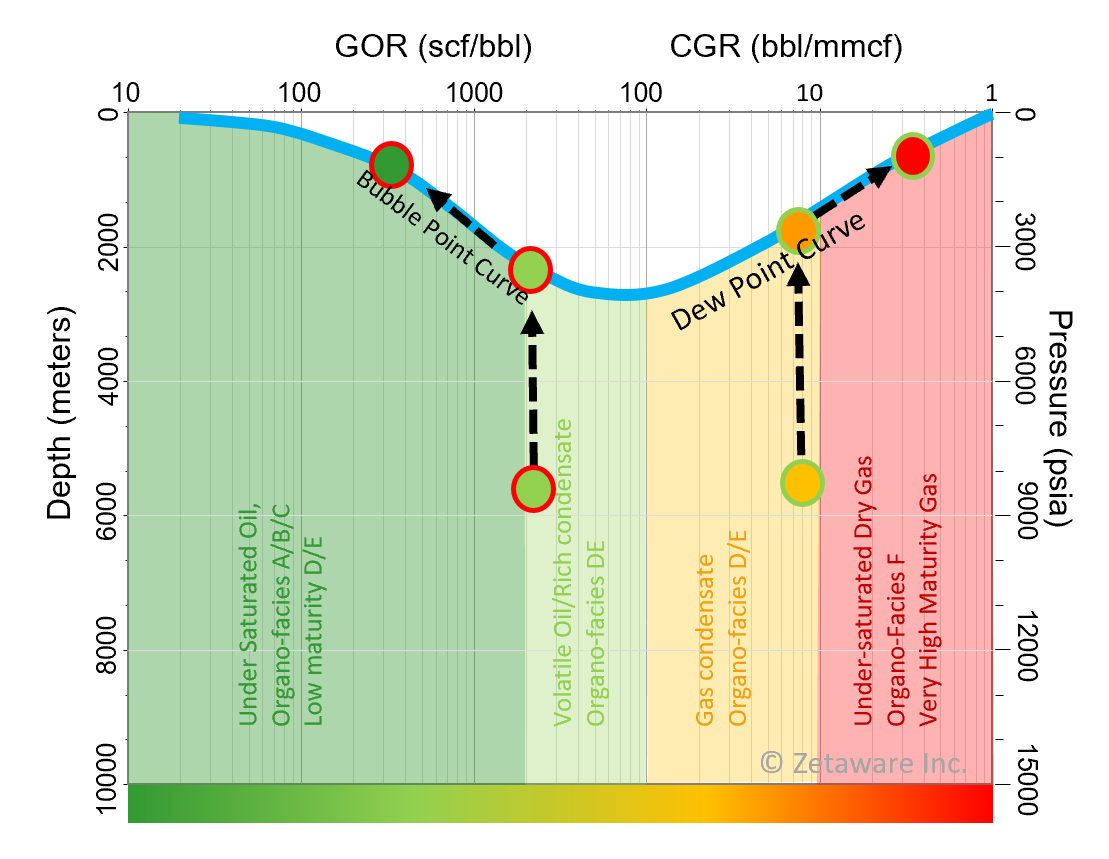
Figure 3. Phase diagram. Green curve is the Glaso (1980) bubble point and red dew point curve of England (2002). At reservoir pressure of 2000 psi, any incoming fluid between 400 scf/bbl and 60,000 scf/bbl will form a dual phase trap. Whether the gas phase, or the oil/condensate phase is preserved depends on the seal capacity and trap closure. Chance of both preserved is very high due to the density differences.

 3) Some of the gas fields, such as the North field in Qatar (largest in the world) and the Astrakhan in Russia, the Rimbey gas field at the deep end of the Leduc reef trend in Alberta, the Norphlet trend in Alabama and the Sichuan gas fields. The commonality of these are they are associated with carbonates, in which thermal cracking of oil can be greatly accelerated by TSR. These fields are all sour (high H2S and CO2). Cracking to gas at oil window temperatures make it likely to happen during migration. In the case of the North field and the Permo-Triassic gas fields in southern Iran and the UAE, there is also evidence that they may have been generated by a low quality Qusaiba facies.    

Figure 4. Effect of TSR on thermal cracking of oil to gas. Gas condensate can be formed at much lower temperatures compared to normal cracking kinetic models. Data from Zhibin Wei et al. 2011.  

4) As usual, these are not the only possible explanations, and often several factors contribute. The main point of this post is that it is relatively rare to find conventional gas accumulations due to a very good oil prone source rock being over mature. The exception being when we started drilling very close to the source kitchen, maturity does come into play. The deeper sub salt fields in the Campos basin offshore Brazil, such as the Pão de Açucar, the Austin Chalk play near the Eagle Ford gas window, and the Elgin-Franklin fields in the North Sea, are examples. These tend to be condensate rich (100-200 bbl/mmscf) as supposed to dry gas. Of course if our target is the source rock itself, we would expect to find gas in the gas window.  
 
The WoS Application

Here I would like to use the example of the West of Shetland basin to demonstrate how to analyze a petroleum system from the top down when traditional PBSM modeling does not provide the answers. The WoS is a Jurassic rift basin in the north Atlantic, and the Kimmeridge Clay formation is an excellent marine source rock. Much modeling work has been focused on the complex thermal history, with rifting, and Eocene volcanism, the source kinetics, the suppressed vitrinite reflectance ..., but have not explained the fluids in the basin.  

Figure 5. Basin modeling results of the WoS. Timing of oil generation predates the deposition of reservoirs. Present day thermal stress is at ~240 C. Note the source rock is not present in the green area. Burial history and maturity map courtesy of Julian Moore.
 The models predicted that the source rock was in the oil window near the end of Cretaceous, and very post mature today. Yet the basin contain mainly oil fields. And the system GOR (adding all gas and oil reserves) is less than 2000 scf/bbl, consistent with the Pepper and Corvi 1995, class B organo-facies. 

Figure 6. The basin hosts several large oil fields, some of which have small gas caps, and some scattered small gas condensate fields. The GOR of these fields plot on a simple phase diagram. PVT data courtesy of APT UK/Julian Moore 

The top down method as applied here is this. Since the source rock is a very oil prone one, with hydrogen index up to 1000 mg/gTOC. The bulk of the accumulations should be oil, regardless of maturity or timing. The GOR and API gravity of the oils should increase with depth due to various reasons, such as migration lag effects, gravity fractionation, and bubble point controls, as shown in figure 6, on the right.  The small gas fields are likely result of phase separation, rather than maturity, and the GOR for those are higher at shallow depth due to dew point control. J. Sales 1997 concept may be at work here, that small traps on spill path will have phase separated gas, whereas large relief structures should contain oil. That is what has been observed here. 

Zhiyong He,

ZetaWare, Inc. 

References:

He Z. and Murray A. (2019) Top Down Petroleum System Analysis: Exploiting Geospatial Patterns of Petroleum Phase and Properties. AAPG Search and Discovery, #42421

Pepper A. and P. Corvi, 1995, Simple kinetic models of petroleum formation. Part III: Modelling an open system. December 1995 Marine and Petroleum Geology 12(4):417-452

Sales, J.K., 1997, Seal strength vs. trap closure—a fundamental control on the distribution of oil and gas, in R.C. Surdam, ed., Seals, traps, and the petroleum system: AAPG Memoir 67, p. 57–83.

Oistein Glaso, 1980 "Generalized Pressure-Volume-Temperature Correlations," Journal of Petroleum Technology. 

England, W.A., 2002, Empirical correlations to predict gas/gas condensate phase behavior in sedimentary basins, Org Chem 2002, 33(6):665-73

Wei, Z. et al., 2012 Thiadiamondoids as proxies for the extent of thermochemical sulfate reduction, Organic Geochemistry, 44 (2012) 53-70