Here are two videos of CCE (constant composition expansion) PVT test videos kindly provided to us by Murray Macleod at Core Labs Perth. These tests are used by engineers to determine bubble or dew point pressure (pressure at which the single reservoir fluid becomes two phase). In this blog I would like to talk about the implication of this in HC migration process. I hope this helps those geoscientists not so familiar with PVT/phase behavior. I wish I had learnt this earlier in my career as a petroleum geologist.
In the CCE tool, the rotating cylinder moves away to expand the volume of the chamber thus lowering the pressure. The first video shows what happens to a single phase volatile oil when pressure is decreased from 8000 to about 1000 psi. At about 3300 psi (which in a basin would be at about 2200 meters depth), vapor (gas) bubble begins to form (hence the term bubble point pressure).
As pressure is further reduced, more and more gas comes out of the solution and takes up the upper part of the chamber and the volume of the liquid decreases significantly (by a factor of more than 2 in this case). What is not obvious (and important for exploration) is that along with that the gas oil ratio (GOR) in the liquid also decreases.
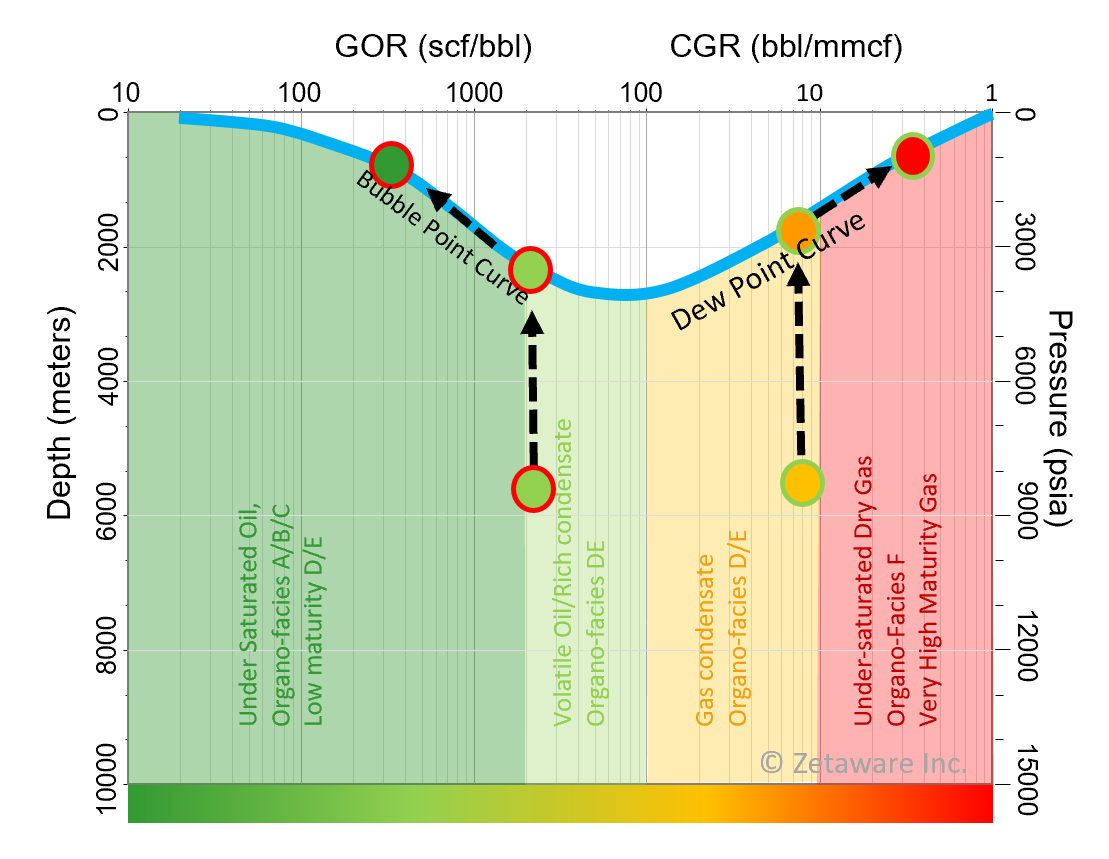
The following figure shows the path of the process in a geological setting. Following the 3 green circles from deep to shallow, the starting volatile oil (deepest green circle) has a GOR of about 2300 scf/bbl. During upward migration, phase separation starts when it reaches about 2200 meters. As the oil continues to migrate to shallower depth, it loses more and more gas. At the shallow depth, the GOR becomes 300 scf/bbl (a black oil).
The lost gas may get trapped in small traps along the way, so we end up with an low GOR oil accumulation. Or if enough of the gas makes to the final trap, we may have a gas cap. If the trap is not able to support the column of oil and gas to spill point, it may leak the gas and retain only the low GOR oil. Or if the seal is very good but the trap is small, all of the oil may spill, and we end up with a gas accumulation.
Again, let me be clear, although the source rock may have supplied a high GOR oil, the final trap may be a low GOR oil accumulation, or a gas accumulation, or an oil accumulation with gas cap. It is determined by the seal and the reservoir pressure!
A similar process applies to gas condensate fluid. Below is a CCE video for gas condensate. As the pressure decreases to dew point, a liquid phase forms at the bottom. The liquid volume increases as pressure decreases and more liquid comes out solution from the vapor phase. The GOR of the vapor increases (CGR decreases). Like the oil case, you may deduct what can happen at the final trap following the red circles in the figure above. Depending on if it leaks or spills, the trap may end up with a higher GOR gas, or a low GOR oil, or both. Check out the AAPG paper by John Sales (1997).
If the starting fluid has a GOR between 3000 and 4000 scf/bbl, whether it is called oil or gas depends on what engineers find in the CCE test. If bubbles form at the top, it is called an oil, and if liquid forms at the bottom, it is called a gas condensate. This is how engineers decide if a field is called oil field or a gas condensate field. Note that even at 4000 scf/bbl, there is still more what geochemists call oil (C6+) in the fluid than gas (C1-5) in weight.
Please let me know what you think by commenting, thanks!
Zhiyong He,
ZetaWare, Inc.